How an AI agent reads a spreadsheet without loading it into context
A big Excel file does not fit in a context window, and RAG quietly gets the arithmetic wrong. Ogcode gives every sheet a one-page profile and a SQL tool, so the workbook never enters the conversation and the answers still add up.


Picture an accountant sitting in front of a ledger with a million rows. You ask: how much did we ship to Norway in March? A good accountant does not read the ledger. They look at the column headers, check a few rows, and run a formula. The ledger stays closed. The answer comes back in seconds.
Now hand the same job to an AI agent. Most coding assistants do the worst possible thing with it: they try to read the ledger.
This post is about how we fixed that in Ogcode. The fix turned out to be two small things that share one brain: a one-page profile of every sheet, and a tool that lets the agent ask the file a real SQL question.
In short: when the question is an aggregate over a whole table, the answer has to be computed over the whole table. That one sentence decides which of the three usual approaches works, and which one quietly lies to you.
First, how does an AI agent meet a spreadsheet?
An agent only sees text, so a spreadsheet has to become text before it can help with anything. Every screenshot of a spreadsheet you have seen in a chat window hides the same problem. There are three moves most assistants make, and all three answer from part of the table.
-
Print it as CSV. A thousand-row sheet becomes a thousand-line blob in the conversation. A hundred-thousand-row sheet does not fit at all, so it gets cut, and the agent answers from whatever part survived the cut. It has no idea what fell off. Meanwhile every one of those rows rides in the context window for the rest of the session.
-
Read it in slices. A read tool opens the file in pieces: forty rows here, a few hundred there. To answer anything real, the agent has to read the whole thing, one expensive slice at a time, into a context window that then carries every slice around for the rest of the day. And many assistants cannot open a real workbook at all: drag in an
.xlsxand you get a polite request to export it as CSV first. -
Bolt on RAG. Split the rows into chunks, embed every chunk into a vector store, and retrieve the top few at question time. This is the standard answer for documents, and for a spreadsheet it is the most dangerous one, because it looks right. RAG hands back a sample, and a spreadsheet question is almost always an aggregate: count these, filter that, group this, join that. A sum over a sample comes back in exactly the same shape as a correct answer, with no error bar and no hint of the thousands of rows it never saw.
Under all three moves sits the same mistake. A spreadsheet is not a document. It has no plot, no conclusion, nothing to carry away after reading. What it has is structure, and structure answers questions. Reading is a machine for taking in everything and answering nothing: “how much did we ship to Norway in March?” is a few milliseconds of SQL, or eight hundred thousand tokens of reading.
Ogcode’s answer: a one-page profile and one SQL question
Ogcode gives the agent the accountant’s opening move. It comes in two parts.
Part one: every sheet gets a one-page profile. Ogcode’s project index already turns documents into pages: a PDF becomes one page per PDF page, each carried by a short label the agent can search. Spreadsheets ride the same rails, and the page text for a sheet is a profile: the sheet’s size, every column with its type and its range, the most common values, and five sample rows. Here is one, for a five-column orders workbook:
Sheet "Orders": 120,000 data rows, 5 columns
Columns:
- sku: text [TEXT]
- product: text [TEXT], distinct: desk-lamp-black, desk-lamp-white, shelf-oak
- qty: integer [INTEGER], min 1, max 240
- ordered_at: date [TEXT], min 2024-01-02, max 2025-11-30
- region: text [TEXT], distinct: EU, US, APAC, LATAM
First 5 rows:
| ODE-4421 | desk-lamp-black | 12 | 2024-01-02 | EU |
That is one screen of text, and it is most of what an accountant needs before running a formula: which column is money, which one is dates, how many rows, what kinds of values live in it. The workbook itself has not entered the conversation. It never will.
The label system has a job here too. In the project map, a workbook does not show up as a single mystery file. It shows its own table of contents:
book.xlsx — forecast scenario; budget assumptions; headcount planThree sheets, three labels, one entry. The agent finds the right sheet by its label before touching anything.
Part two: the question. Next to the profile lives query_sheet, the SQL
tool. The agent writes ordinary SQL, and the tool runs it against the file
itself. Each sheet is a table. So the Norway question is:
SELECT SUM(qty) FROM Orders
WHERE region = 'EU' AND ordered_at BETWEEN '2025-03-01' AND '2025-03-31'
and the reply that lands in the conversation is a handful of lines, not a ledger.
One bound belongs up here, because it decides how you read every number below.
query_sheet loads at most 100,000 rows per sheet by default, and every
answer says so. That is a memory guard, not a claim about your data: lift it
and the full 541,909-row workbook loads in 13.8 seconds and about 1.3 GB. The
three charts further down ran with the cap lifted on the whole file; the
head-to-head benchmark runs on a 100,000-row cut so that every lane sees the
same rows.
The file never enters the context window
The plumbing is simple on purpose. When a query arrives, the tool streams that one sheet into a small in-memory SQLite database. The agent’s SQL runs against the database, and only the answer travels back into the conversation, plus one line naming the sheet’s columns, capped at 200 rows, with three seconds for the query to run.
Two things fall out of that shape.
The agent can ask a hundred questions in a row and the conversation stays
flat. Schema first, a LIMIT sample, the aggregate, a cross-check: the context
cost of a hundred questions is the cost of a hundred answers, not the cost of a
hundred printouts of the file.
And the second: the profile and the query tool can never disagree with each
other, because they share one type reader. The types on the profile page are
the very same types used to build the question tool’s tables. If the profile
says qty is integers, then qty sorts and sums like integers in every query
the agent will ever run against it.
The column types are honest on purpose
The type reader is deliberately pessimistic, and one choice in it is worth showing.
In many tools, a column becomes “numeric” if most of its cells look like numbers. Ours counts every cell as a vote, and a single “N/A” in any cell flips the whole column to text. On purpose. A sum over a column that quietly contains “N/A” is a confident wrong answer, and a confident wrong answer is the worst thing an agent can hand you. If the column is not honestly numbers, nothing downstream pretends it is.
Two more honest-reading details. The first thousand rows are read completely,
then the checker switches to a widening stride, so a column that turns to text
halfway down a huge file is still caught instead of being silently mislabeled
from a lucky sample. And Excel’s private date format, where a calendar day
hides inside an ordinary-looking number, gets translated into real dates, so
min 2024-01-02, max 2025-11-30 on the profile page means what it says.
Two sheets, one question
The capability jump is easiest to see when the answer lives in two sheets at once. “What are the order quantities for the products that are out of season?” is a lookup spread across the Orders sheet and the Products sheet. By reading, that is a manual crosswalk: read one sheet, hold it in your head, read the other, match rows by hand, and hope nothing was cut.
By query, it is one line of the thing spreadsheets were invented for:
SELECT o.sku, SUM(o.qty) AS sold
FROM Orders o JOIN Products p ON o.sku = p.sku
WHERE p.season = 'off'
GROUP BY o.sku ORDER BY sold DESC LIMIT 5
Before, that was the kind of task an agent started and abandoned, because holding two sheets in text at once was never a plan. Now the agent sees two labelled sheets in the same project map and writes one sentence of SQL.
Three questions against a real workbook
Everything so far is an argument. So we capped it the way you cap any claim:
pointed the same two tools, the profile and the SQL tool, at a real workbook.
A 23 MB .xlsx with 541,909 rows: one year and eight days of online retail
invoices, December 2010 to December 2011, 8 columns, 38 countries. Not one of
those rows entered a conversation. Here are three questions the agent asked
it, with the answers that came back. The queries are verbatim.
How did revenue move over the year? One group-by, thirteen rows back.
SELECT strftime('%Y-%m', InvoiceDate) AS month,
       ROUND(SUM(Quantity * UnitPrice)) AS revenue_gbp
FROM "Online Retail"
WHERE InvoiceNo NOT LIKE 'C%'
GROUP BY 1 ORDER BY 1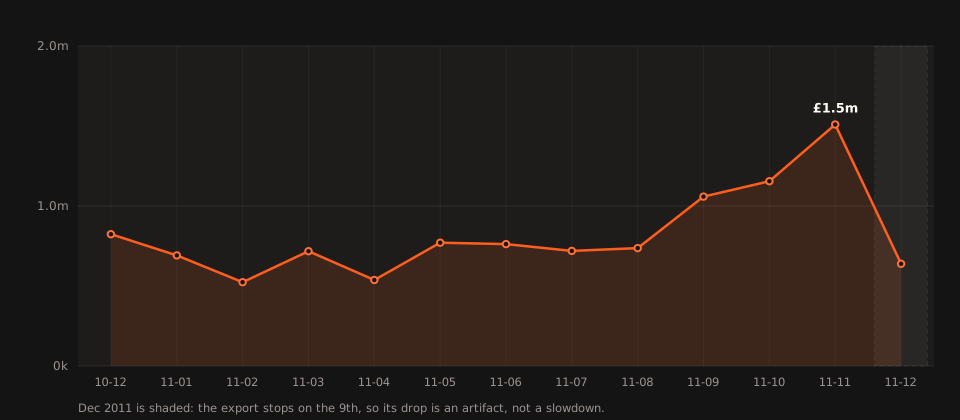
Two things are worth noticing, because an agent that only reads text could not
have done either. The NOT LIKE 'C%' is the agent refusing to book
cancellation invoices as revenue; without it, the peak months carry phantom
sales. And the flat-looking December at the right end is not a downturn: that
export stops on the 9th, and the honest answer says so instead of “revenue
collapsed”. One chart, both traps already dodged.
Which products actually carry the store? This one is a question in two takes, because the first take lies. “Top products by revenue” asked naively returns postage charges and administrative fees, which are stock codes like any other and quietly outearn most of the catalogue. The agent’s second take restricts to real product codes, which all start with a digit:
SELECT Description,
       ROUND(SUM(Quantity * UnitPrice)) AS revenue_gbp
FROM "Online Retail"
WHERE InvoiceNo NOT LIKE 'C%' AND Quantity > 0
  AND StockCode GLOB '[0-9]*'
GROUP BY Description ORDER BY 2 DESC LIMIT 10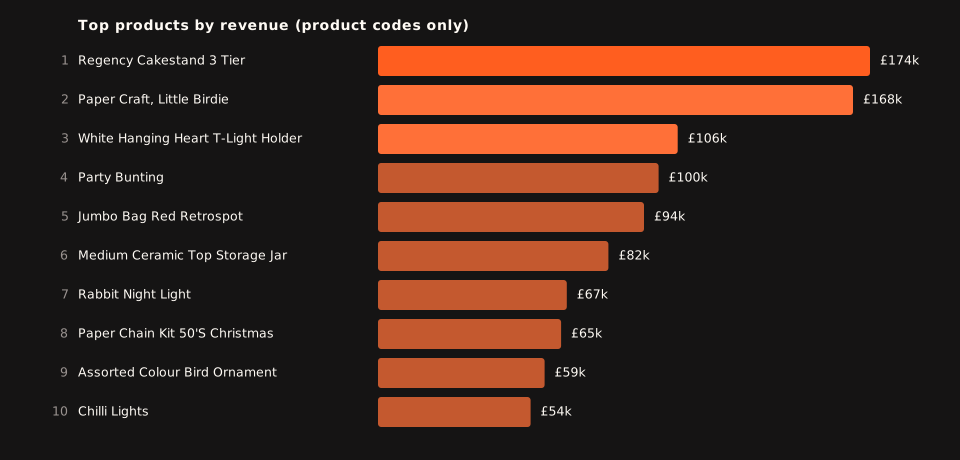
A £174k cakestand and a £168k craft kit. Ask by units instead of revenue and
the ranking changes shape; that comparison is the same question with a
different ORDER BY, not the same question against a second read of the file.
Every follow-up costs one small answer, which is the part of this design we
like most.
When does the money arrive? Hour of day, one more group-by:
SELECT strftime('%H', InvoiceDate) AS hour,
       ROUND(SUM(Quantity * UnitPrice)) AS revenue_gbp
FROM "Online Retail"
WHERE InvoiceNo NOT LIKE 'C%'
GROUP BY 1 ORDER BY 1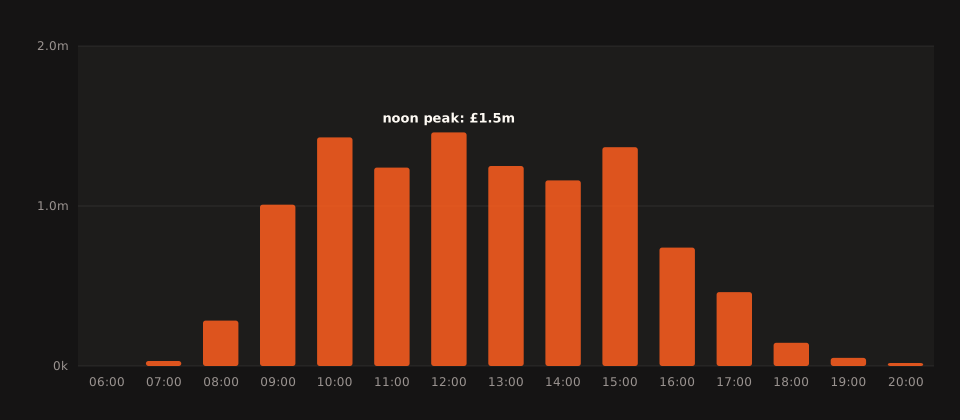
A clear office-hours rhythm: hot from 9 to 4, peak at noon, asleep by 7pm. The kind of shape you only ask for once the first two questions cost nothing, because it was never worth reading 541,909 rows to learn that.
The same file also answers geography in ten rows: the United Kingdom accounts for the overwhelming share, with the Netherlands, EIRE, Germany and France a long way behind as the working international markets. Three queries, three charts, a fourth answer nobody asked to chart, and the whole workbook still sitting on the disk where we found it.
The same workbook, three ways
Everything above is our own tool arguing for itself. So we did what we did for the PDF post: ran the same questions through the three ways a harness can meet a spreadsheet, and counted what each one put into the conversation.
One rule keeps the test fair. A SQL answer is exact only over the rows the tool actually holds, and the question tool loads at most 100,000 rows of a sheet. So the head-to-head runs on the first 100,000 rows of the same workbook: December 2010 through 23 February 2011, 8 columns, 4,657 invoices. Every lane sees exactly those rows, so every lane can in principle be right, and the comparison is about cost and accuracy instead of about one tool quietly seeing a tenth of the file. Token counts are characters divided by four, the same convention as the PDF post: estimates, trust the shape.
| Dimension | Dump the sheet | RAG pipeline | Ogcode: profile, then a query |
|---|---|---|---|
| Setup | nothing to build | cut 100,000 rows into 4,092 windows of about 2,000 characters, embed all of them, tune top-k | one profile page per sheet, written by the same index pass that labels PDFs |
| What the model sees per question | all 100,000 rows as CSV, 8,352,978 characters, about 2,090,000 tokens | the top five windows, about 2,540 tokens, 117 to 134 rows, roughly 0.12 percent of the file | a 292-token profile page, plus SQL that usually costs less than the profile |
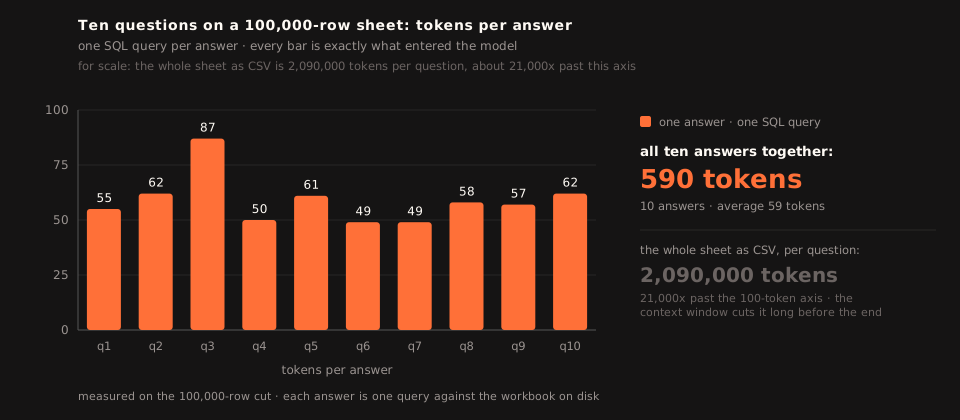
| What one answer costs | the dump bill is paid once and then rides every turn | about 2,540 tokens, plus an embedding round trip | 49 to 87 tokens, measured; all ten questions together cost 590 |
| Where the answer comes from | the model doing arithmetic over 100,000 rows | the rows the retriever happened to return | the database, computing |
| How you check it | you cannot, the sum is the model’s word | the similarity scores, if you kept them | run the query again |
| How it fails quietly | the blob is cut and the model answers from what survived | the retriever returns a thin slice, and a sum over a slice looks just like a sum | it does not, a wrong query returns a visibly wrong number |
| Cost as questions pile up | the whole sheet rides every turn | flat, rebuilt from zero each time | flat, and a follow-up is one more line of SQL |
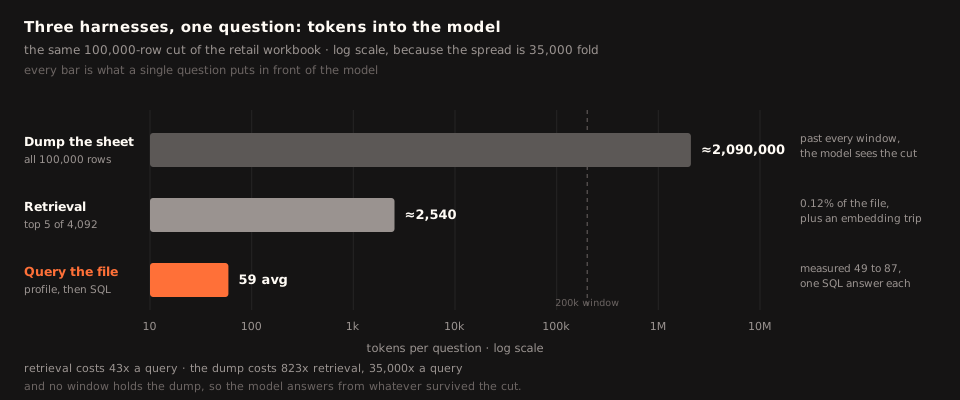
Three bars, and the arithmetic between them is the whole argument: a query is 43 times cheaper than retrieval per question, and the dump is 823 times dearer than retrieval and 35,000 times dearer than a query. The dump is also the only lane that overshoots a context window, so its price is not a bill anybody pays: it is the size of the sheet the model never gets to read.
Ten questions, asked, answered, and measured
The table above is arithmetic on a file size, and estimates are cheap. So we ran the tool for real: ten questions a merchandiser would actually ask, one after another against the same 100,000 rows, with each answer recorded exactly as the conversation received it. Every reply also carries the sheet’s one-line schema, and on the smallest answers that line is most of the bill: about forty of the forty-nine tokens.
| Question | What came back | Tokens |
|---|---|---|
| Total net sales, and how many invoices behind them? | £1,727,708 across 4,657 invoices | 55 |
| Which month earned the most? | 2010-12 at £823,746, then 2011-01 at £691,365 | 62 |
| Top products by revenue, postage and fees excluded? | Medium Ceramic Top Storage Jar £77,184, Regency Cakestand 3 Tier £50,580, White Hanging Heart T-Light Holder £30,093 | 87 |
| What share of revenue comes from the top 20 products? | 17.7 percent | 50 |
| Top three customers by spend? | 12346 at £77,184, then 14646 at £57,866 | 61 |
| How much of net revenue is the United Kingdom? | 85.1 percent | 49 |
| Cancelled value as a share of sold value? | 11.7 percent | 49 |
| Busiest hour of the day by revenue? | 10h at £291,849, then 15h at £283,691 | 58 |
| Rows with no customer ID, and their share of revenue? | 34,915 rows, 19.03 percent | 57 |
| Best non-UK market by revenue? | Netherlands £58,408, then EIRE £44,186, Germany £40,044 | 62 |
| All ten | every answer matches an independent count of the same rows | 590 |
Ten answers, each narrower than the question that produced it, for 590 tokens in total: about 0.03 percent of what dumping the same sheet once costs. The slow part is not the answer. The first query against a file builds the in-memory database, 5.2 to 6.4 seconds and about 537 MB for these 100,000 rows, and every question after it reuses that.
Accuracy: the answer is a computation
Tokens are easy to count. Accuracy is the part that decides whether any of this is worth doing, so we asked the same ten questions through a retrieval lane built from the same rows: 4,092 windows, an embedding index, top five by similarity, about 2,540 tokens per question, with each answer computed from the 117 to 134 rows that actually came back.
That lane was wrong on all ten.
- Total net sales: £1,392, from the 126 rows it saw. True figure £1,727,708.
- Best month: 2011-02 at £2,710. True: 2010-12 at £823,746.
- Top product: Regency Cakestand 3 Tier at £50. True: the storage jar at £77,184.
- Top 20 share: 54.6 percent of the retrieved rows. True: 17.7 percent of the file.
- Top customer: number 17975 at £314. True: 12346 at £77,184.
- UK share: 100 percent. True: 85.1 percent. Every window it found held UK rows.
- Cancellation rate: 0.1 percent. True: 11.7 percent.
- Busiest hour: 13h at £687. True: 10h at £291,849.
- Missing customer IDs: 50 of 122 rows. True: 34,915 rows.
- Best non-UK market: nothing. Not one of the five windows contained a non-UK row.
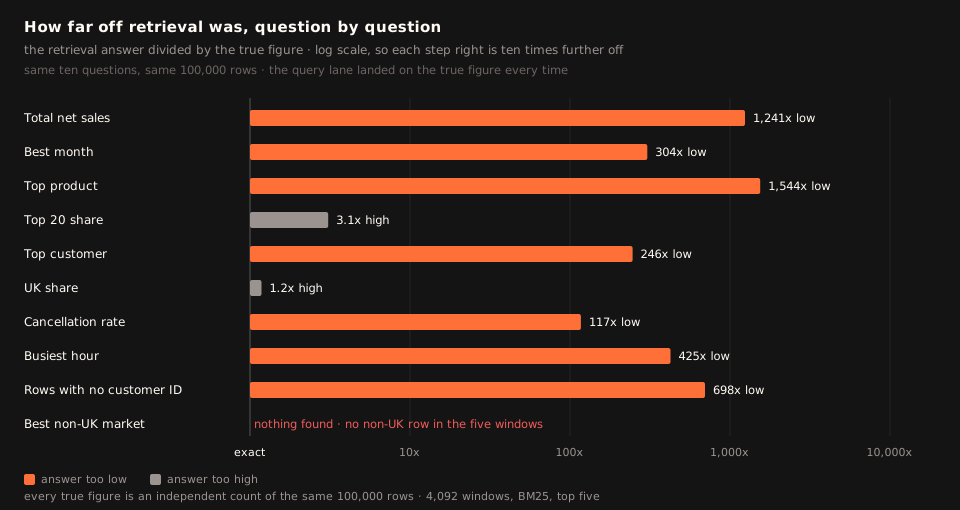
None of those are careless errors, and that is the point. Every one has the same shape: retrieval returns a representative sample, and an aggregate over a representative sample looks exactly like an aggregate over the file. The failure is not a missing sentence you could read around. It is a number with no error bar and no way to see the edge of what it counted.
Three properties of the query design put the answers where they landed.
The unit you retrieve is the unit you compute on. A retrieved row is only worth having if the count runs over all of them. Retrieval hands back 120 rows out of 100,000 and cannot tell you the other 99,880 exist, because the question left the sample behind. SQL runs against the file, so the denominator is the file.
The adding happens in the engine. The model’s job is to write the question, not to total a hundred thousand rows in its head. “The top 20 products are 17.7 percent of revenue” is SQLite’s arithmetic over every row, and the model’s part of it is one sentence of SQL you can read. The dump’s answer, even when the blob fits, is the model’s arithmetic, and the model has no way to show its work.
A wrong answer is visible. 17.7 percent and 54.6 percent are not close enough to argue about. Re-run the query, or change one clause, and the number moves or it does not. A retriever’s miss comes back in the same shape as its hit.
What this does not prove. This was not a tuned RAG pipeline: no reranker, no row-level embeddings, no metadata filter, no hybrid search. A serious one would do better, and there are questions where retrieval is the right tool. The claim here is narrower and measured: on this workbook, every answer from the query lane matched an independent count of the same rows, and the retrieval lane, as built, was wrong on every one.
What you actually run

The dump needs nothing, and on a sheet of a few hundred rows it is the right answer. It stops being an answer the moment the sheet is bigger than the window, and a spreadsheet that matters usually is.
RAG needs a chunker, an embedding model, a vector store, a retrieval step, and the tuning that makes those four agree with each other, plus a second copy of the data living in the store instead of on your disk.
Ogcode’s spreadsheet path needs two things: a profiler that writes one page per sheet, and a query tool that builds SQLite from the file and runs the agent’s SQL against it. There is no second copy and no index to keep in sync, and no embedding model to re-run when you switch providers. The profile is regenerated from the file itself, so a workbook edited yesterday answers questions about yesterday’s numbers.
What it costs is bounded and stated out loud: the first question against a file pays a load, five to seven seconds at up to 100,000 rows here. Beyond that the tool answers from the rows it loaded, and tells you it did.
Where this could still be better
No post about our own tools should pretend they are perfect. The limits, in the open:
- Very big sheets are capped at load time. The question tool loads up to 100,000 rows per sheet, and it says so in every answer it gives. The cap is not arbitrary: lifting it on the full 541,909-row workbook above takes 13.8 seconds and about 1.3 GB of memory to build the database, per file. A count over a two-million-row sheet sees the loaded subset, honestly labeled, with no pretended exactness. The three charts earlier in this post ran with the cap lifted on the whole file; the ten-question gauntlet runs on a 100,000-row cut so that every lane can be exactly right.
- Numbers come back as the engine prints them. A money column can arrive
as
1.72770842e+06rather than1,727,708, because the cell is formatted by Go’s default float printing. A model reads it fine; a human skimming the transcript may not. Rounding the output is on the list. - Old formats are out. The tool speaks
.xlsx,.xlsm,.csvand.tsv. The ancient.xlsbinary and the OpenDocument.odsare not read today; save them as.xlsxor CSV and everything works. - Read-only, for now. The agent can ask anything and cannot change anything. Writing back edits to a workbook is on the list, and we would rather do it carefully than quickly.
- 200 rows per answer. Deliberate, so no single question can flood the
conversation. A second question with
LIMITandOFFSETpages through the rest.
The idea in one sentence
An agent facing a spreadsheet needs exactly what a good accountant needs: the summary on the cover, and one honest question to run through the tool built for it. Give the agent that, and a workbook that used to be a conversation-ending blob becomes one profile screen and a handful of answers, while the other hundred thousand rows sit quietly on the disk where they belong.
Comments
Join the discussion
Comments run on GitHub Discussions — sign in with GitHub, and the thread lives alongside the repo.
Open the discussion on GitHub